Abstract:
Data science is the study of data to extract meaningful insights for business. It is a multidisciplinary approach that combines principles and practices from the fields of mathematics, statistics, artificial intelligence, and computer engineering to analyze large amounts of data.
Data science is emerging as a field that is revolutionizing science and industries alike. Work across nearly all domains is becoming more data driven, affecting both the jobs that are available and the skills that are required. As more data and ways of analyzing them become available, more aspects of the economy, society, and daily life will become dependent on data. It is imperative that educators, administrators, and students begin today to consider how to best prepare for and keep pace with this data-driven era of tomorrow. Undergraduate teaching, in particular, offers a critical link in offering more data science exposure to students and expanding the supply of data science talent.
Data science is everywhere right now. One after the other, companies worldwide are turning to data science to solve the most diverse problems out there. This situation has put data scientists in an advantageous position regarding employment and payment.
Naturally, a lot of people are becoming interested in learning how to become a data scientist.
Keywords: Data, Science, What to learn, Software Engineering, Hardware Engineering, Skills
Outcome:
After undergoing this article you will be able to understand the tools, techniques, criteria and skills required for
Establishing yourself as a best data scientist.
1. Introduction: What Does a Data Scientist Do?
An incredible opportunity is waiting for you. Technology is changing the world by connecting billions of devices and improving how we live, work, play and treat our planet. No industry is immune to AI. Are you ready to change your life, and possibly make the world a better place for living?
In a business environment, they work across multiple teams to lay the foundations for robust analytics. This means developing strategies to capture, gather, and clean data from a range of sources. After organizing and exploring this data, they can then build it solutions and communicate their findings to the wider business.
Data scientists often work with other professionals, including data engineers, analysts, IT architects, application developers, and business stakeholders.
2. Why Become a Data Scientist - a Career Choice?
There are many reasons why someone may choose to pursue a career in data science. It’s an industry that can be immensely rewarding, providing an intellectually challenging and stimulating environment. Data scientists must keep ahead of the latest technological trends and developments, working in an often dynamic setting.
So, if you’re intellectually curious, have an analytical mind, and love working with data and technology, becoming a data scientist could be for you.
Furthermore, there are many opportunities for talented data scientists in the job market. So the core reasons of becoming data scientist are as follows
1. Good career
2. Growth prospects
The US Bureau of Labour Statistics predicts a 36% rise in data science industry jobs.This growth is reflected in the popularity of data science careers, with organizations such as the U.S. News & World Report ranking data scientist as the 3rd best job in technology, 6th best in STEM jobs, and 6th best overall job. Similarly, Glassdoor ranks it as the 3rd best job in America for 2022.
If you’re still not convinced why you should think about this career, the average data scientist salary could be appealing. With a median salary of $102k per year, it’s clear to see that the demand for data scientists is met with a generous pay packet.
3. What Qualifications do Data Scientists Need?
There is some debate as to whether a degree is necessary for someone to become a data scientist. Plenty of professionals have entered the industry through other routes, but a university qualification can certainly be beneficial.
Most graduate schemes and graduate jobs look for individuals with qualifications in fields such as computer science, data science, mathematics, statistics, engineering, and even physics. However, some schemes will train anyone with a degree to become a data scientist. A working knowledge of programming languages such as Python, R, SQL, and/or Julia can be helpful.
Unlock new opportunity
Master the tools to lead in a data-driven world, connecting new opportunities in existing industries alongside exciting emerging roles.
Empower your learning
Benefit from passionate academics and global industry experts to power up your understanding.
Manage a world of data
Develop your ability to manage and communicate complex data insights.
Flexible future opportunity
Business and society are transforming into connected, data-rich landscapes where complex data insights and informed decision making are crucial drivers of success. Embrace your potential with data science course that teaches you to apply data-driven insight alongside technical, managerial capabilities and AI applications . Gain a platform of informed insight to guide decision making and unlock emerging opportunities.
Connect to a world of opportunity
B.Tech. Data Science is driven by a team of passionate academics and industry experts with experience in real-world data science applications. You will gain a detailed understanding of AI and data science's concepts, theories, and tools, providing both the knowledge and understanding of how to apply them to build your career and boost your business potential.
Unleash your data potential
Data science expertise is a high-demand skillset in industries from oil and gas to healthcare, financial services to exciting new digital platform ecosystems.
4. What Skills Do Data Scientists Need?
To master in Data science, you’ll need an assortment of hard and soft skills. Some of the skills are as follows
Hard Skills
These are the technical skills you’ll need to develop to become a fully-fledged data scientist:
Python
R
Statistics and math
SQL and NoSQL
Data visualization
Machine learning
Deep learning
Natural language processing
Big data
Cloud computing
Soft Skills
These are now usually referred to as ‘power skills’ or ‘human skills,’ and they are the cross-functional skills that aren’t job specific but are still necessary. For a data scientist, these include:
Communication
Storytelling
Critical thinking
Business acumen
Problem-solving
Teamwork
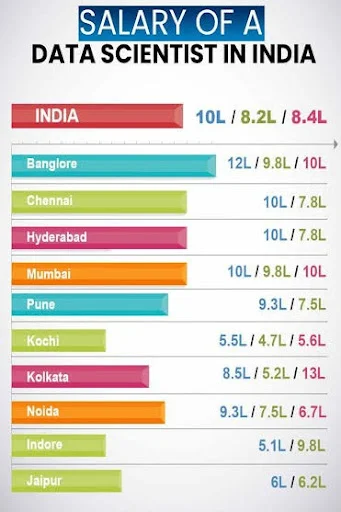
5. What is an Average Data Scientist Salary?
Average salary data differs between sources. For example, in the US, Glassdoor give an average salary of $117,212 per year based on a sample of 18,000 salaries, whereas PayScale estimates $97,318 per year, based on 7,280 salary profiles.
Data science managers are generally the top earners, with a salary range of $113,000 - $230,000 per year.
+ Data scientists and data engineers tend to have a similar salary, ranging from $82,000 - $167,000 per year for scientists and $76,000 - $166,000 per year for engineers.
+ Company size matters;
# with companies of more than 1,000 employees paying a median salary ranging from $90,000 to $110,000 per year, compared to around $80,000 for medium-sized companies (26 to 1,000 employees) and
# $60,000 for small companies and startups (2-25 members).
Careers Progression
Leading Recruiters
Trained professionals are needed by technologically driven companies across the platforms:
Google
Amazon
Facebook
FMGC Companies as they are producing smart machines
All e-commerce companies like Snapdeal / Flipkart
6. How to Become a Data Scientist ?
The Curriculum Targets
The curriculum targets technical and design skills, AI knowledge, and competencies needed to master strategic analytical methods and tools, and data management, with the objective of creating innovative strategies to solve challenging real-world problems.
Essential Subjects
Artificial Intelligence
Machine Learning Techniques
Neural Networks
Deep Learning
Reinforcement Learning
Data Visualization and Presentation
Information Retrieval and Text Analytics
Social Network Analysis
Real Time Data Streaming
Data and Information Security
Intelligent Systems
Deep Learning
Reinforcement Learning
Natural Language Processing
Text Technologies for Data Science
Data Analytics and Mining
Big Data Management
Bayesian Data Analysis
Probabilistic Modeling and Reasoning
Cloud Technologies
Internet of Things
Statistical Learning.

By now, you’re likely eager to get started on your journey to becoming a data scientist. But where to start? Below, we’ve highlighted eight steps you need to take to become a data scientist from scratch.
These are some of the most commonly cited steps:
1. Learn data wrangling, data visualization, and reporting
As you work to become a data scientist, you’ll often encounter large and complex datasets. To make sense of this information (for yourself and others), you’ll need to learn how to deal with it. This is where skills in data wrangling come in handy. This is where you’ll clean, organize, and transform raw data into a format you can analyze and draw conclusions from.
There are various tools you can use with data wrangling, but libraries like pandas in Python are often the go-to choice. You can check out our data wrangling in Python with pandas cheat sheet for more info.
When it comes to presenting your data with impact, you’ll need to master reporting and data visualization. You can find out more about some of the best data visualization tools out there, giving you a range of options depending on your ultimate goal.
2. Work on your statistics, math, and machine learning skills
While you don’t necessarily need a degree that covers these fields, you do need a functional knowledge of these areas. Generally, you’ll want to cover areas such as calculus, linear algebra, and statistics. However, it’s worth assessing your intent behind learning these things.
For example, learning calculus can help you learn to create optimization algorithms for machine learning, although there are functions in both Python and R that can take care of the calculus for you.
As a specific example, understanding a topic like gradient descent can help you measure the change in a function’s output when you tweak the inputs, which can help to refine machine learning models. If you’re looking to brush up on your linear algebra skills, our Linear Algebra for Data Science in R course can help you work with vectors and matrices, solve matrix-vector equations, perform eigenvalue/eigenvector analyses and use principal component analysis to do dimension reduction on real-world datasets.
These areas are all useful for applied mathematics and data science. Similarly, Intermediate Statistical Modeling in R covers some of the essential machine learning statistics topics, helping you make progress in key areas.
3. Learn to code
In our article on the top programming languages for data scientists, we explore in detail some of the best languages you should consider learning right now. Two of the most obvious choices for data scientists are Python and R, given their versatility and ubiquity.
Of course, working with data also means working with databases, so SQL is another essential programming language. Thankfully, it’s a relatively straightforward language once you’ve learned Python and R.
With a language like Java, you get an open-source language known for it’s efficiency and performance. For data science, Java Virtual Machines provide a solid and efficient framework for popular big data tools, such as Hadoop, Spark, and Scala.
Other coding languages worth learning for data science with very large data sets include Scala, C/C++, JavaScript, Swift, Go, MATLAB and SAS.
4. Understand databases
We mentioned SQL in the topic above, and it’s a point that bears repeating. Relational databases allow data scientists to store structured data in a fast and efficient way.
When collecting and organizing data, you’ll often find that SQL is your preferred tool here. SQL allows you to handle structured data, query databases, wrangle, prepare, and experiment with data, and more. What’s more, SQL is often deployed alongside Python, with libraries such as SQLite, PostgreSQL, and MySQL helping you connect different data sources.
5. Keep your pace to work with big data
In an era where everything and everyone is producing more data than ever before, these data sets are increasingly huge, making them harder to collect, maintain and process.
Yet from these huge data sets, a skilled data scientist can extract new and detailed insights. So, learning to use cloud platforms such as AWS, Microsoft Azure, and Google Cloud can all benefit your career as a data scientis. Similarly, tools like Apache Spark can help with big data processing, analysis and machine learning.
6. Acquire experience and practice regularly
As with any career, to become a data scientist, you’ll need as much experience and practice as possible. Luckily, there are many ways that you can get involved with communities, work on projects, and develop your data science skills.
For example, DataCamp Workspace provides a collaborative cloud-based notebook that allows you to analyze data, collaborate with others, and share insights. Workspace is designed to take you from learning data science to doing data science. It also has built-in datasets, so you can start analyzing data within minutes.
7. Grab an internship and/ or apply for a job in good company
Once you’re confident you have the data scientist skills needed to meet the expectations of a role, you can start applying for internships or jobs.
Check out our full guide on applying for data science jobs and learn how to set yourself apart from other candidates. You’ll likely need a fairly thorough portfolio demonstrating a range of skills. you have to prepare for the data scientist interview ahead of schedule time.
8. Follow and remain engaged with community activities
There is no better way to stay informed about developments in data science than by engaging with what can often be a generous and dedicated community.
As well as social media sites such as LinkedIn, Twitter, Discord, and Reddit, there are all kinds of niche sites, blogs, and data science leaders you can follow. Look for people who are interested in the same areas as you, reach out for advice and contribute to discussions, and get involved with what’s going on.
5. Conclusions
A critical task in the education of future data scientists is to instill data acumen. This requires exposure to key concepts in data science, real-world data and problems that can reinforce the limitations of tools, and ethical considerations that permeate many applications. Key concepts involved in developing data acumen include the following:
Mathematical foundations,
Computational foundations,
Statistical foundations,
Data management and curation,
Data description and visualization,
Data modeling and assessment,
Workflow and reproducibility,
Communication and teamwork,
Domain-specific considerations, and
Ethical problem solving.
The practice of data science can best be described as a combination of analytical engineering and exploration. The business presents a problem we would like to solve. Rarely is the business problem directly one of our basic data mining tasks. We decompose the problem into subtasks that we think we can solve, usually starting with existing tools. For some of these tasks we may not know how well we can solve them, so we have to mine the data and conduct evaluation to see. If that does not succeed, we may need to try something completely different. In the process we may discover knowledge that will help us to solve the problem we had set out to solve, or we may discover something unexpected that leads us to other important successes.

Neither the analytical engineering nor the exploration should be omitted when considering the application of data science methods to solve a business problem. Omitting the engineering aspect usually makes it much less likely that the results of mining data will actually solve the business problem. Omitting the understanding of process as one of exploration and discovery often keeps an organization from putting the right management, incentives, and investments in place for the project to succeed.
Frequently Asked Questions
1. What is Data Science?
An interdisciplinary field that constitutes various scientific processes, algorithms, tools, and machine learning techniques working to help find common patterns and gather sensible insights from the given raw input data using statistical and mathematical analysis is called Data Science.
The following figure represents the life cycle of data science.
It starts with gathering the business requirements and relevant data.
Once the data is acquired, it is maintained by performing data cleaning, data warehousing, data staging, and data architecture.
Data processing does the task of exploring the data, mining it, and analyzing it which can be finally used to generate the summary of the insights extracted from the data.
Once the exploratory steps are completed, the cleansed data is subjected to various algorithms like predictive analysis, regression, text mining, recognition patterns, etc depending on the requirements.
In the final stage, the results are communicated to the business in a visually appealing manner. This is where the skill of data visualization, reporting, and different business intelligence tools come into the picture. Learn More.
2. What is the difference between data analytics and data science?
Data science involves the task of transforming data by using various technical analysis methods to extract meaningful insights using which a data analyst can apply to their business scenarios.
Data analytics deals with checking the existing hypothesis and information and answers questions for a better and effective business-related decision-making process.
Data Science drives innovation by answering questions that build connections and answers for futuristic problems. Data analytics focuses on getting present meaning from existing historical context whereas data science focuses on predictive modeling.
Data Science can be considered as a broad subject that makes use of various mathematical and scientific tools and algorithms for solving complex problems whereas data analytics can be considered as a specific field dealing with specific concentrated problems using fewer tools of statistics and visualization.
The following Venn diagram depicts the difference between data science and data analytics clearly:
3. What are some of the techniques used for sampling? What is the main advantage of sampling?
Data analysis can not be done on a whole volume of data at a time especially when it involves larger datasets. It becomes crucial to take some data samples that can be used for representing the whole population and then perform analysis on it. While doing this, it is very much necessary to carefully take sample data out of the huge data that truly represents the entire dataset.
There are majorly two categories of sampling techniques based on the usage of statistics, they are:
Probability Sampling techniques: Clustered sampling, Simple random sampling, Stratified sampling.
Non-Probability Sampling techniques: Quota sampling, Convenience sampling, snowball sampling, etc.
You can download a PDF version of Data Science Interview Questions.
4. List down the conditions for Overfitting and Underfitting.
Overfitting: The model performs well only for the sample training data. If any new data is given as input to the model, it fails to provide any result. These conditions occur due to low bias and high variance in the model. Decision trees are more prone to overfitting.
Underfitting: Here, the model is so simple that it is not able to identify the correct relationship in the data, and hence it does not perform well even on the test data. This can happen due to high bias and low variance. Linear regression is more prone to Underfitting.
5. Differentiate between the long and wide format data.
Long format Data Wide-Format Data
Here, each row of the data represents the one-time information of a subject. Each subject would have its data in different/ multiple rows. Here, the repeated responses of a subject are part of separate columns.
The data can be recognized by considering rows as groups. The data can be recognized by considering columns as groups.
This data format is most commonly used in R analyses and to write into log files after each trial. This data format is rarely used in R analyses and most commonly used in stats packages for repeated measures ANOVAs.
The following image depicts the representation of wide format and long format data:
6. What are Eigenvectors and Eigenvalues?
Eigenvectors are column vectors or unit vectors whose length/magnitude is equal to 1. They are also called right vectors. Eigenvalues are coefficients that are applied on eigenvectors which give these vectors different values for length or magnitude.
A matrix can be decomposed into Eigenvectors and Eigenvalues and this process is called Eigen decomposition. These are then eventually used in machine learning methods like PCA (Principal Component Analysis) for gathering valuable insights from the given matrix.
7. What does it mean when the p-values are high and low?
A p-value is the measure of the probability of having results equal to or more than the results achieved under a specific hypothesis assuming that the null hypothesis is correct. This represents the probability that the observed difference occurred randomly by chance.
Low p-value which means values ≤ 0.05 means that the null hypothesis can be rejected and the data is unlikely with true null.
High p-value, i.e values ≥ 0.05 indicates the strength in favor of the null hypothesis. It means that the data is like with true null.
p-value = 0.05 means that the hypothesis can go either way.
8. When is resampling done?
Resampling is a methodology used to sample data for improving accuracy and quantify the uncertainty of population parameters. It is done to ensure the model is good enough by training the model on different patterns of a dataset to ensure variations are handled. It is also done in the cases where models need to be validated using random subsets or when substituting labels on data points while performing tests.
9. What do you understand by Imbalanced Data?
Data is said to be highly imbalanced if it is distributed unequally across different categories. These datasets result in an error in model performance and result in inaccuracy.
10. Are there any differences between the expected value and mean value?
There are not many differences between these two, but it is to be noted that these are used in different contexts. The mean value generally refers to the probability distribution whereas the expected value is referred to in the contexts involving random variables.
11. What do you understand by Survivorship Bias?
This bias refers to the logical error while focusing on aspects that survived some process and overlooking those that did not work due to lack of prominence. This bias can lead to deriving wrong conclusions.
12. Define the terms KPI, lift, model fitting, robustness and DOE.
KPI: KPI stands for Key Performance Indicator that measures how well the business achieves its objectives.
Lift: This is a performance measure of the target model measured against a random choice model. Lift indicates how good the model is at prediction versus if there was no model.
Model fitting: This indicates how well the model under consideration fits given observations.
Robustness: This represents the system’s capability to handle differences and variances effectively.
DOE: stands for the design of experiments, which represents the task design aiming to describe and explain information variation under hypothesized conditions to reflect variables.
13. Define confounding variables.
Confounding variables are also known as confounders. These variables are a type of extraneous variables that influence both independent and dependent variables causing spurious association and mathematical relationships between those variables that are associated but are not casually related to each other.
14. Define and explain selection bias?
The selection bias occurs in the case when the researcher has to make a decision on which participant to study. The selection bias is associated with those researches when the participant selection is not random. The selection bias is also called the selection effect. The selection bias is caused by as a result of the method of sample collection.
Four types of selection bias are explained below:
Sampling Bias: As a result of a population that is not random at all, some members of a population have fewer chances of getting included than others, resulting in a biased sample. This causes a systematic error known as sampling bias.
Time interval: Trials may be stopped early if we reach any extreme value but if all variables are similar invariance, the variables with the highest variance have a higher chance of achieving the extreme value.
Data: It is when specific data is selected arbitrarily and the generally agreed criteria are not followed.
Attrition: Attrition in this context means the loss of the participants. It is the discounting of those subjects that did not complete the trial.
15. Define bias-variance trade-off?
Let us first understand the meaning of bias and variance in detail:
Bias: It is a kind of error in a machine learning model when an ML Algorithm is oversimplified. When a model is trained, at that time it makes simplified assumptions so that it can easily understand the target function. Some algorithms that have low bias are Decision Trees, SVM, etc. On the other hand, logistic and linear regression algorithms are the ones with a high bias.
Variance: Variance is also a kind of error. It is introduced into an ML Model when an ML algorithm is made highly complex. This model also learns noise from the data set that is meant for training. It further performs badly on the test data set. This may lead to over lifting as well as high sensitivity.
When the complexity of a model is increased, a reduction in the error is seen. This is caused by the lower bias in the model. But, this does not happen always till we reach a particular point called the optimal point. After this point, if we keep on increasing the complexity of the model, it will be over lifted and will suffer from the problem of high variance. We can represent this situation with the help of a graph as shown below:
As you can see from the image above, before the optimal point, increasing the complexity of the model reduces the error (bias). However, after the optimal point, we see that the increase in the complexity of the machine learning model increases the variance.
Trade-off Of Bias And Variance: So, as we know that bias and variance, both are errors in machine learning models, it is very essential that any machine learning model has low variance as well as a low bias so that it can achieve good performance.
Let us see some examples. The K-Nearest Neighbor Algorithm is a good example of an algorithm with low bias and high variance. This trade-off can easily be reversed by increasing the k value which in turn results in increasing the number of neighbours. This, in turn, results in increasing the bias and reducing the variance.
Another example can be the algorithm of a support vector machine. This algorithm also has a high variance and obviously, a low bias and we can reverse the trade-off by increasing the value of parameter C. Thus, increasing the C parameter increases the bias and decreases the variance.
So, the trade-off is simple. If we increase the bias, the variance will decrease and vice versa.
16. Define the confusion matrix?
It is a matrix that has 2 rows and 2 columns. It has 4 outputs that a binary classifier provides to it. It is used to derive various measures like specificity, error rate, accuracy, precision, sensitivity, and recall.
The test data set should contain the correct and predicted labels. The labels depend upon the performance. For instance, the predicted labels are the same if the binary classifier performs perfectly. Also, they match the part of observed labels in real-world scenarios. The four outcomes shown above in the confusion matrix mean the following:
True Positive: This means that the positive prediction is correct.
False Positive: This means that the positive prediction is incorrect.
True Negative: This means that the negative prediction is correct.
False Negative: This means that the negative prediction is incorrect.
The formulas for calculating basic measures that comes from the confusion matrix are:
Error rate: (FP + FN)/(P + N)
Accuracy: (TP + TN)/(P + N)
Sensitivity = TP/P
Specificity = TN/N
Precision = TP/(TP + FP)
F-Score = (1 + b)(PREC.REC)/(b2 PREC + REC) Here, b is mostly 0.5 or 1 or 2.
In these formulas:
FP = false positive
FN = false negative
TP = true positive
RN = true negative
Also,
Sensitivity is the measure of the True Positive Rate. It is also called recall.
Specificity is the measure of the true negative rate.
Precision is the measure of a positive predicted value.
F-score is the harmonic mean of precision and recall.
17. What is logistic regression? State an example where you have recently used logistic regression.
Logistic Regression is also known as the logit model. It is a technique to predict the binary outcome from a linear combination of variables (called the predictor variables).
For example, let us say that we want to predict the outcome of elections for a particular political leader. So, we want to find out whether this leader is going to win the election or not. So, the result is binary i.e. win (1) or loss (0). However, the input is a combination of linear variables like the money spent on advertising, the past work done by the leader and the party, etc.
18. What is Linear Regression? What are some of the major drawbacks of the linear model?
Linear regression is a technique in which the score of a variable Y is predicted using the score of a predictor variable X. Y is called the criterion variable. Some of the drawbacks of Linear Regression are as follows:
The assumption of linearity of errors is a major drawback.
It cannot be used for binary outcomes. We have Logistic Regression for that.
Overfitting problems are there that can’t be solved.
19. What is a random forest? Explain it’s working.
Classification is very important in machine learning. It is very important to know to which class does an observation belongs. Hence, we have various classification algorithms in machine learning like logistic regression, support vector machine, decision trees, Naive Bayes classifier, etc. One such classification technique that is near the top of the classification hierarchy is the random forest classifier.


Comments
Post a Comment
"Thank you for seeking advice on your career journey! Our team is dedicated to providing personalized guidance on education and success. Please share your specific questions or concerns, and we'll assist you in navigating the path to a fulfilling and successful career."